by Dennis Crouch
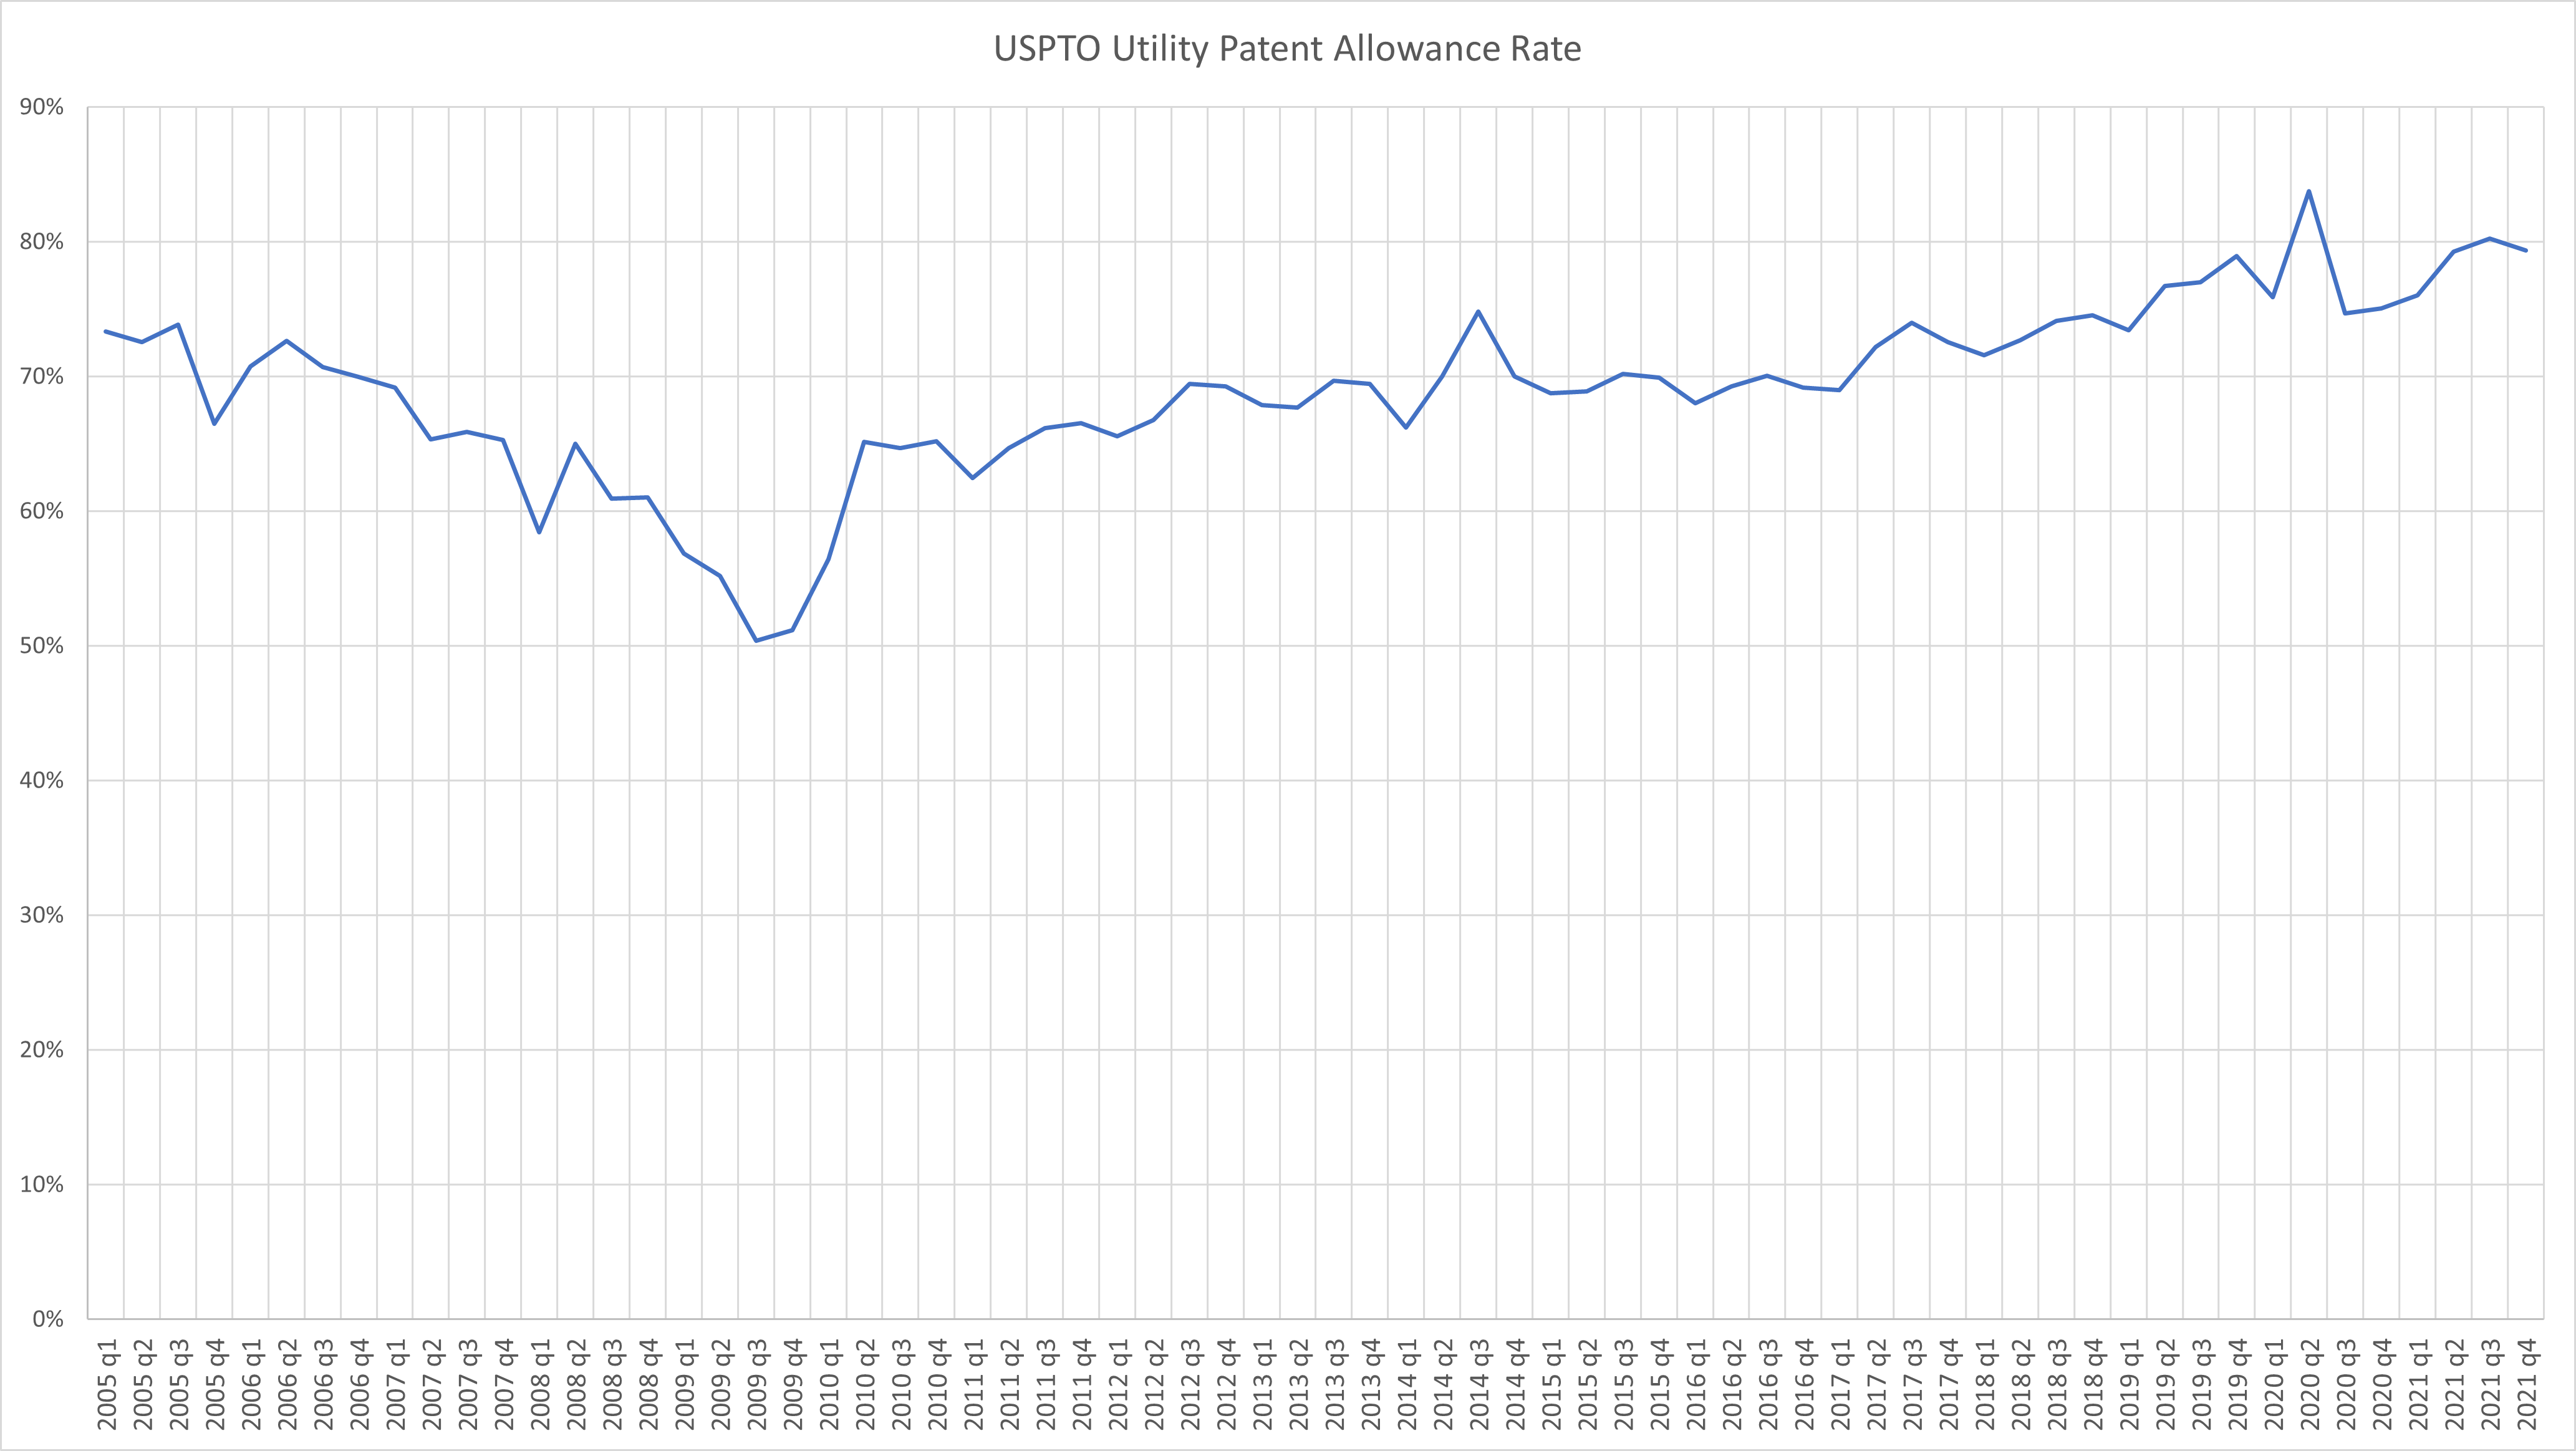
The chart below shows the USPTO utility patent allowance rate broken up on a quarterly basis (using calendar year quarters). The rate is based upon two numbers: The number of patents issued each quarter, and the number of applications abandoned each quarter. Allowance Rate = Patents / (Patents + Abandonments). Because I only have detailed abandonment data on published applications, I limited all the data to only published applications. I generally expect that the grant rate for unpublished applications to be a bit lower.
Note the drop in allowance rate during the Bush years while Jon Dudas was USPTO Director. David Kappos quickly reset expectations. And, since then we have seen a steady rise in allowance rate. Kappos also brought the steady handed Drew Hirshfeld into a leadership role where he has remained through three presidencies.
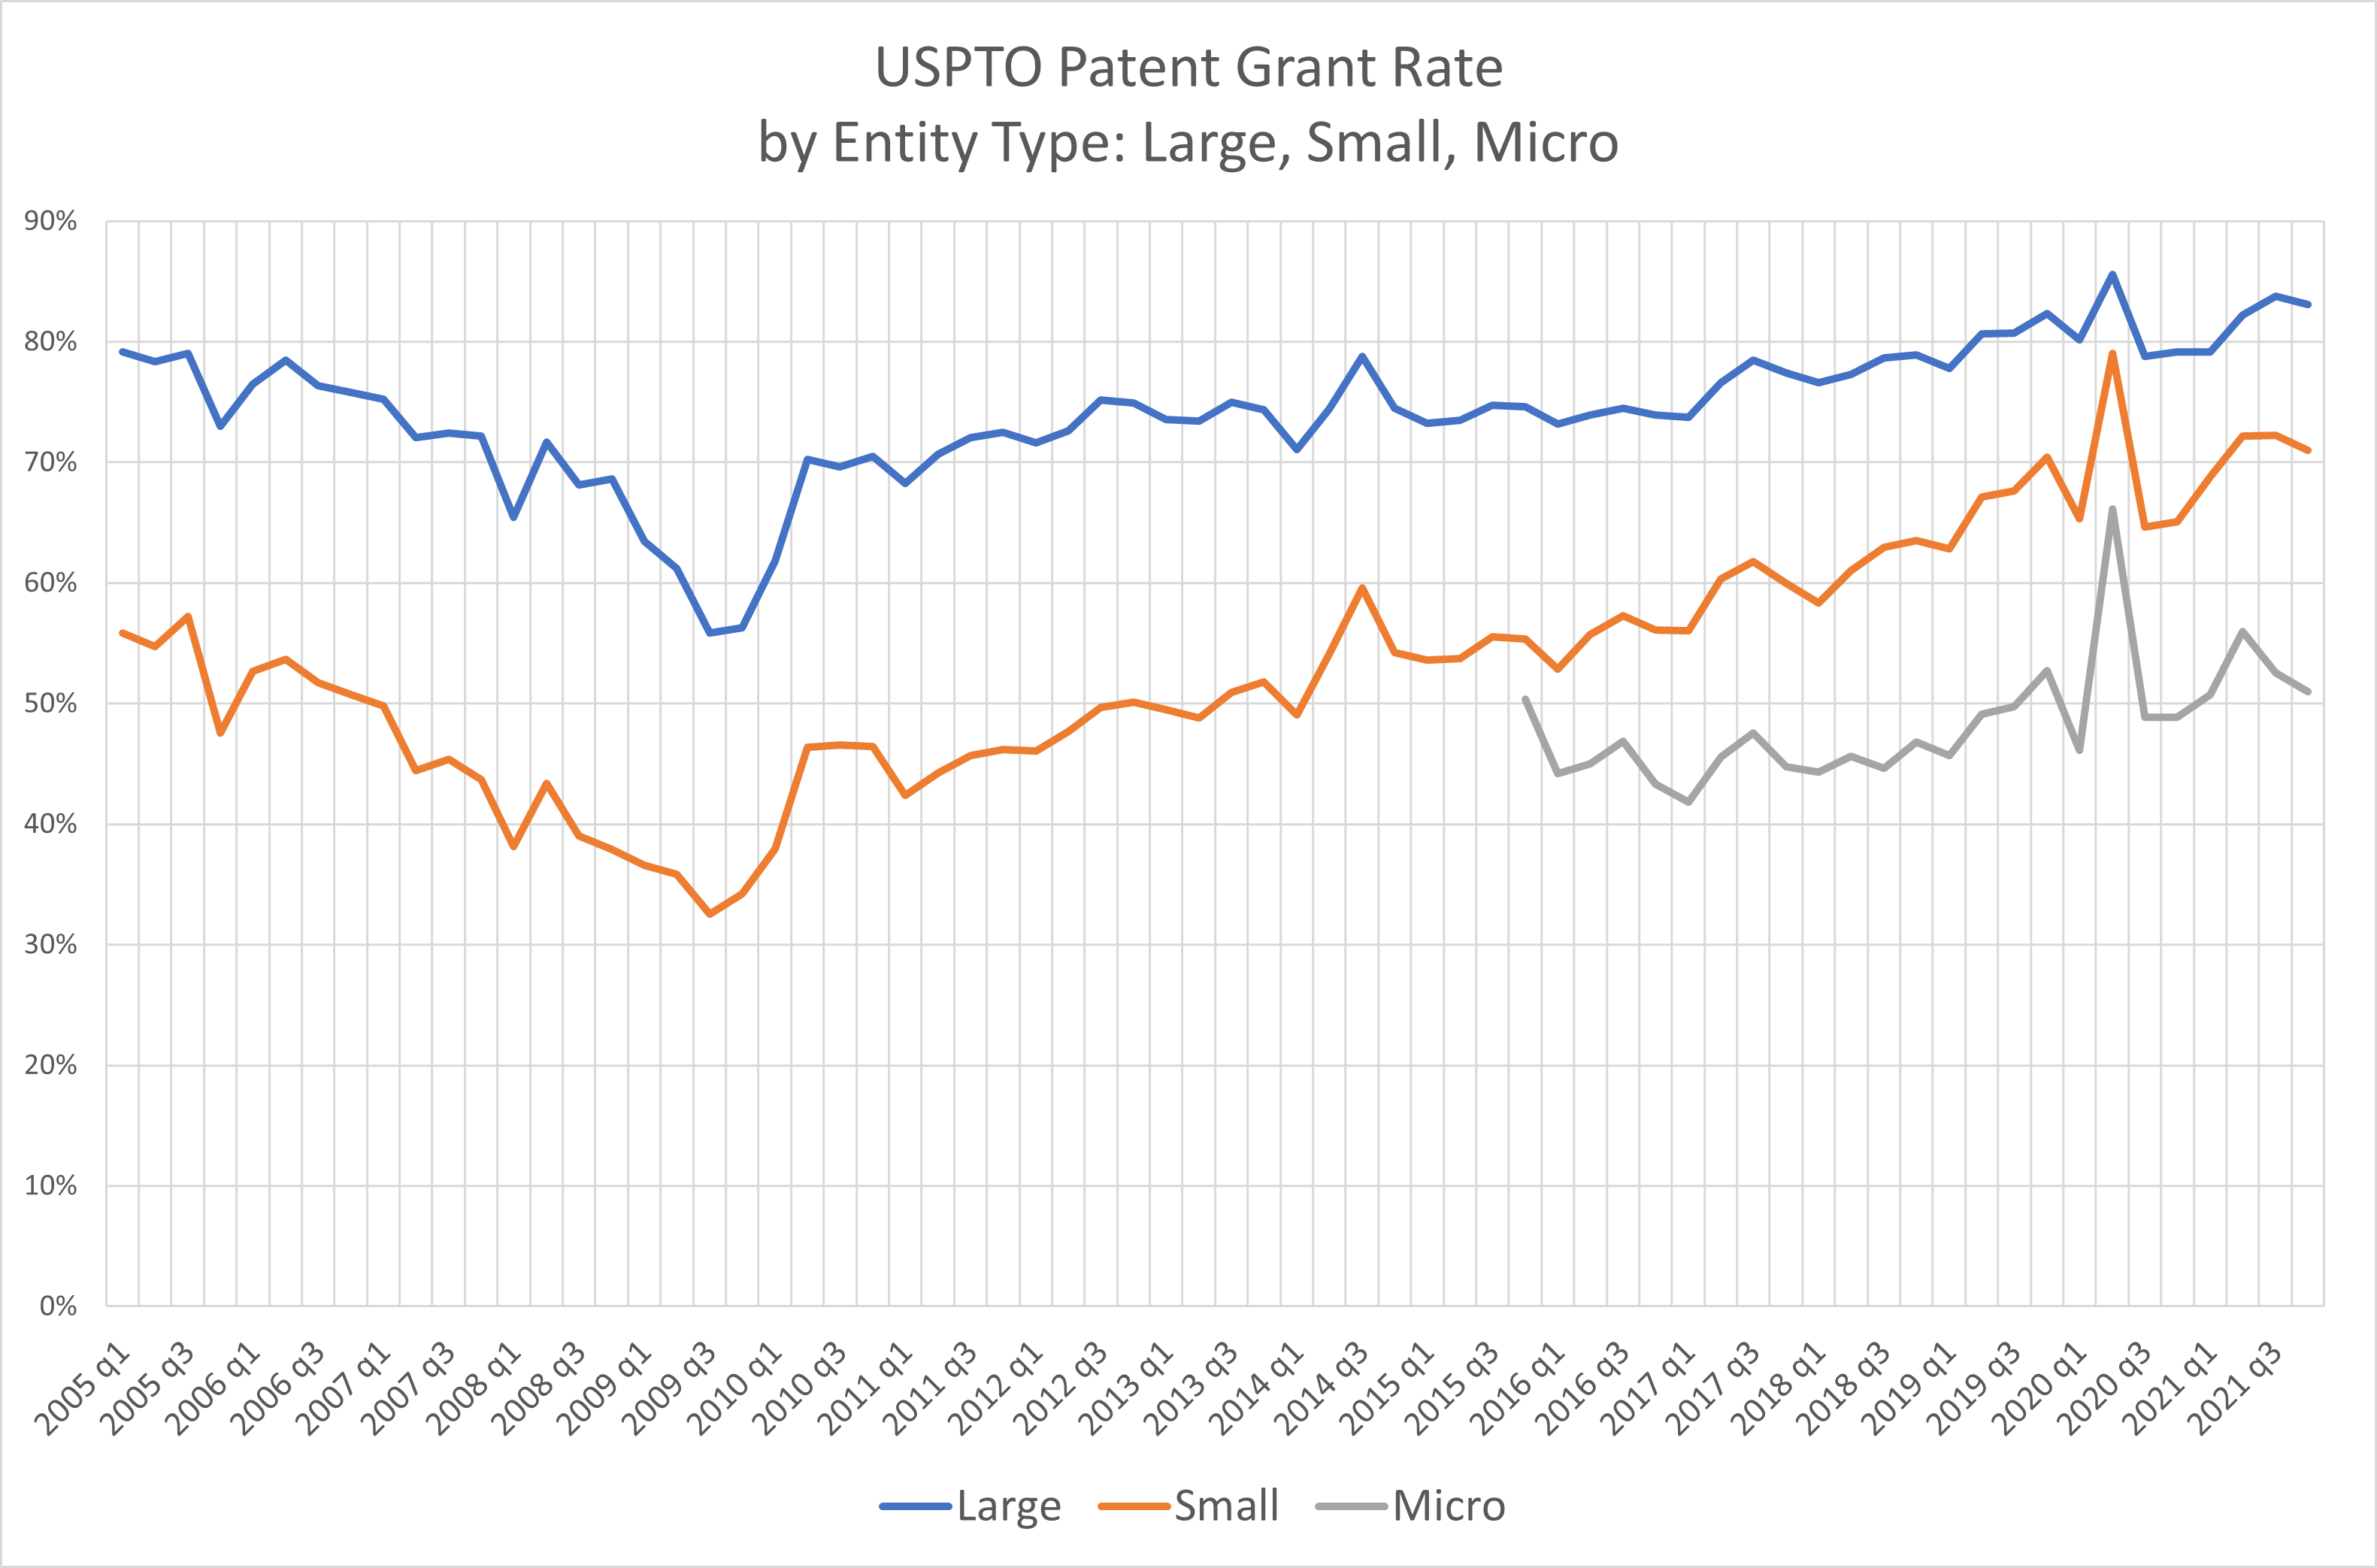
 The second chart breaks this down by entity type. You’ll notice the spike in 2nd Qtr 2020 at the beginning of COVID. We had a dip in abandonment during that time. The CARES Act and action by Dir. Iancu allowed some applicants to delay abandonment. Some of the waivers were directly applicable only to small/micro entity applicants, and that may be the explanation for the impact.
There is an easy explanation for any upward trend (no matter how the final ratio is mashed):
Patent attorneys (and yes, Paul, the only proper way of designating those registered with the patent office and not merely litigators) are better scriviners than the courts, and by and large seek to work their way around the scrivenings of the anti-patent courts.
Of course, this should not ever be expected to hit 100%, as challenge and push-back should be expected.
An observation…
When I looked recently at allowance rates in Australia (using essentially the same measure that Dennis uses here) I found a very similar trend since 2009. Notwithstanding the disruptive effect of substantive changes in law in 2013, overall allowance rates rose from just under 70% in 2009 to just under 80% in 2020. There is no non-publication option in Australia, so these numbers are based on complete data.
While it is tempting to attribute the rise in US allowance rates over this period to changes in administration, that cannot account for an almost identical trend in Australia. Of course, this could simply be coincidence. Or there could be a causal relationship (e.g. the Australian patent office being influenced by USPTO practices). Or there may be something going on in terms of applicant behaviour that is independent of any individual national office. For example, an increase in allowance rates may be related to emergence from the GFC.
The data itself is not ‘misleading’, as some have suggested. It is exactly as Dennis has described it. The interpretation of the data, however, is open to debate. I don’t know the answer. I note only that abandonment ultimately reflects an applicant decision, and PTO practice is only one factor among many that may inform that decision.
The data itself is not ‘misleading’, as some have suggested.
I wonder if the real beef about “misleading” stems from the term “allowance rate”? I gather from 2.2.1 that the objection is that “allowance” reflects the culmination of actions over a course of years, rather than a discreet phenomenon of the year in which the grant happens. Would everyone be copacetic if Prof Crouch had said “percentage of favorable dispositions” instead of “allowance rate”? That would make the chart relevant and informative nevertheless, but without the quibble about “allowance.”
“Would everyone be copacetic if Prof Crouch had said “percentage of favorable dispositions” instead of “allowance rate”?”
This seems unlikely as, at 2.2.1.3.1, WT appears to object to the graph being used to convey any relationship between policy and leadership.
Though I could be wrong as, being a non-attorney, I was confused by his ambiguity on whether the data itself or Crouch’s use of it was misleading.
2.2.1.3.1.1.1. makes it pretty clear there Ben.
GFC….?
A blast from the past:
As I recall there was one more after this – with the 40% mark being breached.
link to patentlyo.com
Does anyone else find the second chart interesting? There seems to be a significant disparity between grant rates of small and large entities.
It would be interesting to see stats on continuations and abandoned cases with respect to small and large entities. It may shed some light on the disparity.
. . . which raises the related, also interesting question of which entity type has the greatest percentage (not raw #s) of cons, divs, cips, and abandonments.
E.g., one would reasonably presume that micros utilize divs and cips less often; but is this correct?
Re: “There seems to be a significant disparity between grant rates of small and large entities.”
Yes, but the difference appears to be decreasing. Could that be due to the many out-sourced staff reductions in former large company in-house patent attorneys [often more familiar with their art and prior art] and/or from former applicants of micro entity qualifications getting their own and much larger fee subsidies from large entities and no longer being included in with small entities?
There seems to be a significant disparity between grant rates of small and large entities.
Money and experience make a difference. Large entities will almost always have more money to spend (better attorneys and can handle the oftentimes extended prosecution) and more experience with the process (e.g., being able to self-filter questionable applications before they are even filed).
This is not surprising in the least.
Indeed, some large companies do have an internal system to review and approve or deny their inventor’s proposals for patenting things for apparent novelty, scope and potential value to their business.
But also there seems to be a general trend for large companies to use more and more costs controls on preparation & prosecution of applications, including more outsourcing that is not hiring highly expensive patent attorneys [in contrast to litigation]. Also, in many large IPL firms the P&P is usually done by associates.
Bush brought us Dudas and the Iraq War. So we could put him up there in the ranks of worst presidents. However, Josef Biden is shaping up to be–by far–worst of all time.
Franklin Pierce and James Buchanan wish to contest your ranking. Given the death toll of the civil war into which they maneuvered us, I think that they have a solid, empirically verifiable point.
i tried to stir the pot a little on a Friday, but no takers
. . . and now it’s too late for such stirring . . . given that it’s now Saturday. 🙂
(but let’s throw the Constitution-usurping Trump into the worst-presidents pot and see what happens . . . )
Constitution-usurping….?
Are you referring to the twice impeached but not convicted items or something else?
And then after that, would you care to compare the current Puppet, Biden?
“Are you referring to the twice impeached but not convicted items”
Yes, that.
“would you care to compare the current Puppet, Biden?”
Well . . . Trump was certainly no puppet. (though he (correctly) escaped impeachment, he’s not going to escape federal indictment for the financial fraud he’s committed)
As for Biden? Yes, puppet is accurate. With folks like shumer, Pelosi, and AOC working the strings.
Pro say — your use of legal terms is off.
While Trump may well be found guilty (in a criminal sense) or liable (in a civil sense), the fact that neither impeachment resulted in conviction removes any sense of “Constitutional usurping.”
You do realize that “impeach” means “charged with,” eh?
Or would you deem ANY criminal of civilly liable person to rise to the level of “Constitutional usurper?”
“the fact that neither impeachment resulted in conviction removes any sense of “’Constitutional usurping.'”
Oops. You’re correct. Though impeached, he was not convicted.
As far as the Constitution usurping, I’m aggregating all the actions (e.g. ordering Pence to withhold certifying the vote) and non-actions (e.g. not telling the mob to go home when they first breached the fences — a true patriot would have stood before the mob and ordered them to stop and go home).
The Constitution and democratic norms meant — and still mean — nothing to him.
He’ll be in jail stripes before he again wears the title of President.
Thankfully for America . . . and indeed the free world.
As I noted, your “aggregating” does not rise to the term you selected (Constitution usurping).
Please be aware of the MSM kool-aid that has infected your statements.
The chart is highly misleading in the way that the data has been “processed.”
That “dip” (hailed by the Dudas administration as “record quality”) in the 2009 era actually dropped into the 30’s.
Label this thread as “misinformation” and move on.
Source: Trust me bro.
A – I’d love to get this right, but I don’t how my data is misleading.
A – I’d love to get this right, but I don’t how my data is misleading.
This is just a guess, but I’ll explain it this way. I’m assuming your numbers are looking at allowances + abandonments for any given year.
When you are looking at how certain Commissioners have impacted examination, you have to realize that while an allowance reflects current examination policy, and abandonment goes back much further. In the vast majority of instances I am aware, an abandonment is preceded by years of rejections.
Consider the Dudas reign of terror at the USPTO. The applications that were abandoned during that time probably were abandoned based upon years worth of prosecution that already preceded Dudas’s appearance at the USPTO. Also, rejections that were instituted during his time may have been subsequently withdrawn when Kappos came on board.
As such, looking at just abandonments during Dudas’s reign does not accurately reflect just how stingy the USPTO was at that time.
I doubt there is anything you can with the data to account for this. To recap, an allowance reflects the policy at the moment of the allowance. However, an abandonment typically reflects the policy going back many years. Additionally, an allowance in year 5 of examination (with a new Commissioner) doesn’t capture the rejections in years 1-4 of examination (with a different Commissioner).
Right, so Prof. Crouch’s chart does not illustrate everything worth knowing about examination regimes over time. What the chart does illustrate, however, is accurate as far as it goes.
We know that ~90% of utility applications publish (URL below). Non-pub request applications that eventually grant still show up in the data set for the chart above. That means that the applications missing from the total are in the single digits of the total, percentage wise. These are just too few to merit a concern that they are skewing the conclusions appreciably.
link to patentlyo.com
In addition to Wt’s point, the “math” here is trying to compare apples and oranges in a single year — if you want to do a proper allowance rate, you have to allowances TO their respective filings.
Allowances in year X has no causal link to applications submitted in the same year X.
Thanks — good points here.
“looking at just abandonments during Dudas’s reign does not accurately reflect just how stingy the USPTO was at that time.”
That is not at all a case for the graph being “misleading.” No data perfectly describe an environment, and the failure to do so does not make data misleading.
This graph could possibly be used misleadingly if it was placed in an article suggesting that the Dudas Drop was not so bad, but there is no hint of such a suggestion in the post.
I find it amazing that science educated attorneys will assert that accurate data in a post not deliberately advancing any false narrative is “misleading.” Since none of us are achieving anything by posting here, I must assume these are sincerely held beliefs. And so I can only conclude that these are intellectually broken individuals (Not to be taken as necessarily directed at you, WT, as I am unclear on whether you think this graph is “misleading”).
I find it amazing that science educated attorneys will assert that accurate data in a post not deliberately advancing any false narrative is “misleading.”
Because you are not an attorney, you don’t have the experience identifying how “data,” “facts,” “assertions,” what-have-you can be manipulated. The deliberate manipulation of facts/law/etc. is something that good attorneys are aware of because we see it all the time.
Assuming that Dennis did his math correctly (which I am), then I’m sure his chart accurately reflects the number of allowances divided by the number of allowances + abandonments for a particular time period. However, before one can label data accurate or misleading, we first have to figure out what that data is being used for.
In this instance, Dennis made a comment about allowance rates with regard to past USPTO Commissioners. In essence, Dennis was inferring that there was some relationship between the Commissioner and examination policy, and this relationship could be discerned from the graph reproduced above. I think that this is a valid use of the data.
Anon’s point wasn’t that this data was inaccurate. Rather, Anon’s point was that the data (i.e., graph) was misleading, and I agree for the reasons I pointed out above. Specifically, the data is misleading as it does not accurately characterize the differences in how easy/hard it was to get an allowance during a time period associated with a particular Commissioner. The result is that while the data accurately shows that the examination policy changed under Dudas (to the detriment of applicants), the data very likely does not accurately disclose the magnitude of the difference. In short, while it makes Dudas looks bad (at least to applicants) is actually makes him look better than reality.
While some think of Michelle Lee as a particularly bad Commissioner (at least in the eye’s of applicants), as for me, Dudas tops them all (or is at the bottom of the list depending upon the sort). Dudas manipulated data. Dudas was responsible for a great number of proposed rule changes that would have made it much harder on applicants. Fortunately, most (if not all) of the proposals died on the vine.
Had Alice came out on his watch I would have suspected that the allowance rate would have dropped to near 20% (or much worse). In my opinion, he was a blight upon the Patent Office.
“In essence, Dennis was inferring that there was some relationship between the Commissioner and examination policy, and this relationship could be discerned from the graph reproduced above.”
Dennis, was this your intent?
Dennis, was this your intent?
This is what Dennis wrote:
Note the drop in allowance rate during the Bush years while Jon Dudas was USPTO Director. David Kappos quickly reset expectations. And, since then we have seen a steady rise in allowance rate. Kappos also brought the steady handed Drew Hirshfeld into a leadership role where he has remained through three presidencies.
What else (besides “some relationship between the Commissioner and examination policy”) could Dennis be inferring from those comments?
As the Sup. Ct. has recently noted [re IPR reconsideration motions] the PTO Director is the one who is entitled to be setting PTO examination policies. Past problems seem to have mainly occurred with some prior presidential appointments of PTO Directors with no real patent experience or qualifications.
I would have thought experience as a lawyer would help you identify alternative possible meanings associated with statements. Though I’ll admit that my experience here strongly suggests a deficiency in that skill amongst patent attorneys.
Looks like we won’t be getting a response anyways. Oh well.
Correction: “amongst a subset of patent attorneys”.
“Consider the Dudas reign of terror at the USPTO. ”
Lets dudas lads! Woot woot!
” the Dudas Drop was not so bad”
It really wasnt.
It was – as it directly spawned backlogs on every deck of the Titanic, as well as more than one legal action against the power-grabbing Office (have you forgotten Tafas?).
Tafas was amazing and scheduled for complete USPTO victory but for weakling new director who probably couldn’t even do a pull up. And as we all know, backlogs are just job creators bro.
🙂
Dhdhdhgggff
“scheduled for complete USPTO victory ”
I see that you are still clinging to that indoctrinated state of delusion there 6.
Not only did your man-crush GET crushed with Tafas, but follow-on power grabs were also quickly defeated.
Can’t handle that you were scheduled for complete USPTO victory and the gov still regards it as practically a complete victory can you anon?
6,
Literally no one even remotely believes the Gov won in the Tafas case.
No one of sound mind, that is.
How — with some minimal explanation — do you feel otherwise?
Curious how everyone remembers Tafas but not GSK. It’s almost like he was scripted to play the mouse that distracts us from the elephant.
In other words,
“The rate is based upon two numbers: The number of patents issued each quarter, and the number of applications abandoned each quarter.”
is a comparison of two numbers, but that is not an allowance rate. It is meaningless.
is a comparison of two numbers, but that is not an allowance rate. It is meaningless.
Agree.
Anon – Is there some better way of finding the grant rate that you are hiding?
“hiding”
What an odd characterization.
Thanks for the charts. Very interesting, especially the second one. I think there is a compelling story there that needs to be investigated.
Rogan and Dudas were the absolute worst USPTO leaders during the course of my career and made even Lehman look good in comparison. Kappos was a breath of fresh air.
Would not counting abandonments of applications that were abandoned in favor of allowable continuations, CIPs or divisionals make these allowance % rates somewhat higher? Or, at least balance out those noted-as-unmeasurable abandonments among the relatively low percentage of applications with filed and maintained U.S.-only non-publication-requests?
Allowance rate for a family as a whole should be a bit higher.
As those are — non-published — what basis do you have for characterizing as “relatively low percentage”…?
Our Major client had a default “non-publish” protocol.
Maybe not comment on prosecution matters, eh Paul?
For the past decade about 92% of patents were published prior to issuance. So, we’re at about 8% unpublished.
Only if you pretend that the number that you cannot see was 0.
It is a known fact that such is not the case, so the best that you can (accurately) state is that the 8% is a floor.
Can we compare that 8% to other percentages for other items that our active commentators ascribe to? For example, what has been the trend (and what percentage are we at now) for the use of the Jepson claim format?
Anon – I don’t understand what you are saying here.
You are aware that your 8% cannot cover the instances in which no patent issued, eh?
Which would include all items filed in the past and for which prosecution has not been completed. Undoubtedly, applications filed multiple years ago are still under prosecution, so any indication of an “allowance rate” for any year in which items filed that year have not been finalized is just not accurate.
What numbers you DO see thus cannot only serve as a floor.
Anon – I don’t understand what you are saying here.
A fairly evergreen observation, that one. I gave up making this point because it gets tedious repeating oneself so relentlessly.
Greg is either a
L
I
A
R
or a
F
O
O
L
or both, as he makes a derogatory statement on something that he professes that he has blocked and cannot read.
The epitome of mindless ad hominem.
Comments are closed.